Documentation Index
Fetch the complete documentation index at: https://docs.rated.network/llms.txt
Use this file to discover all available pages before exploring further.
Interpreting the Gini
A Gini coefficient of 0 reflects perfect equality, where all income or wealth values are the same, while a Gini coefficient of 1 (or 100%) reflects maximal inequality among values.
Gini calculation
We first take the stake weight of each of the validators on the latest day and rank in descending order accordingly. We then use the 1-2B formula for measuring Gini, where B is the area under the Lorenz curve such that:
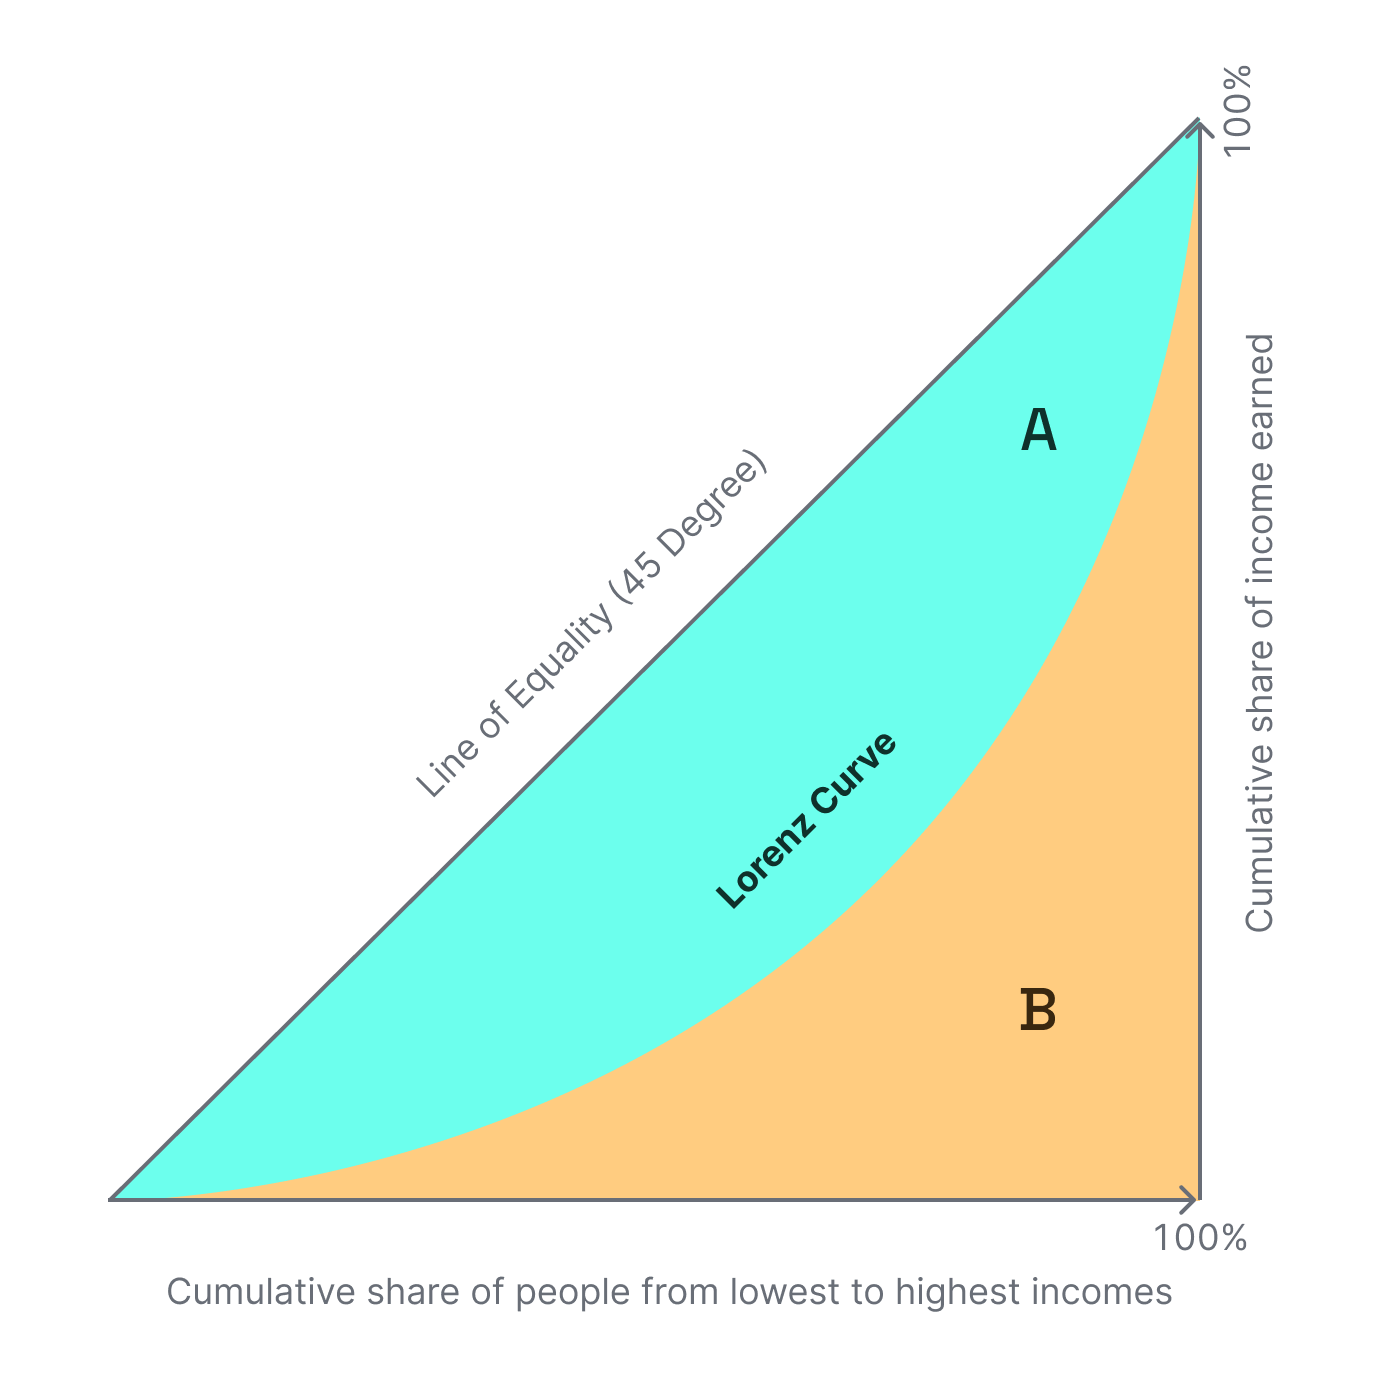
1−2×COUNT(validators)×SUM(staked SOL)SUM(staked SOL×(rank−1)+staked SOL/2)
Function Components
staked SOL×(rank−1)
is the area of the rectangular horizontal slice under the Lorenz curve
2staked SOL
is the area of the triangle on the left of the rectangular slice
SUM(staked SOL×(rank−1)+2staked SOL)
is the sum of all the slices
COUNT(validators)
normalizes the x axis to the range 0 to 1
SUM(staked SOL)
normalizes the y axis to the range 0 to 1
SUM(staked SOL)