> ## Documentation Index
> Fetch the complete documentation index at: https://docs.rated.network/llms.txt
> Use this file to discover all available pages before exploring further.
# Gini coefficient measurement
> This page details the approach Rated uses in computing this metric for the Solana network.
## Interpreting the Gini
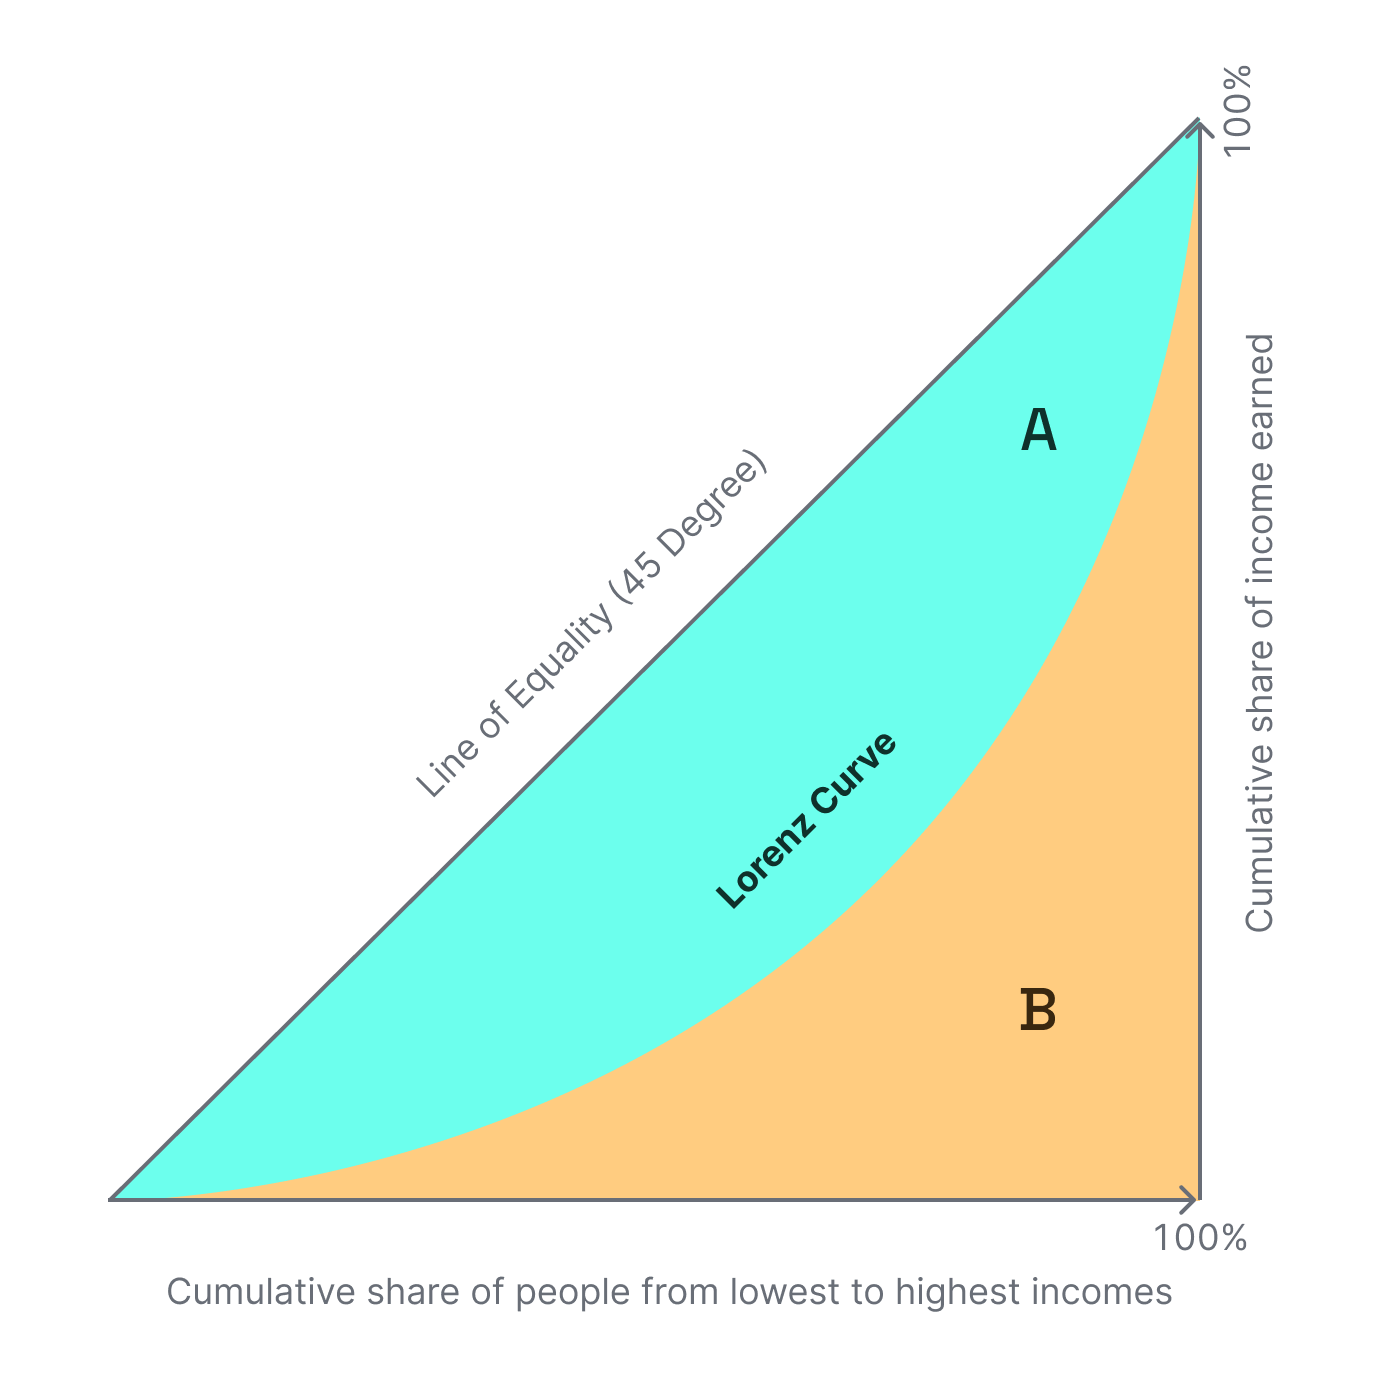
A Gini coefficient of 0 reflects perfect equality, where all income or wealth values are the same, while a Gini coefficient of 1 (or 100%) reflects maximal inequality among values.
## Gini calculation
We first take the stake weight of each of the validators on the latest day and rank in descending order accordingly. We then use the 1-2B formula for measuring Gini, where B is the area under the Lorenz curve such that:
$$
1 - 2 \times \frac{\text{SUM}(\text{staked SOL} \times (\text{rank} - 1) + \text{staked SOL} / 2)}{\text{COUNT(validators)} \times \text{SUM}(\text{staked SOL})}
$$
 ### Function Components
$$
\text{staked SOL} \times (\text{rank} - 1)
$$
is the area of the rectangular horizontal slice under the Lorenz curve
$$
\frac{\text{staked SOL}}{2}
$$
is the area of the triangle on the left of the rectangular slice
$$
\text{SUM}(\text{staked SOL} \times (\text{rank} - 1) + \frac{\text{staked SOL}}{2})
$$
is the sum of all the slices
$$
\text{COUNT(validators)}
$$
normalizes the x axis to the range 0 to 1
$$
\text{SUM}(\text{staked SOL})
$$
normalizes the y axis to the range 0 to 1
$$
\text{SUM}(\text{staked SOL})
$$
### Function Components
$$
\text{staked SOL} \times (\text{rank} - 1)
$$
is the area of the rectangular horizontal slice under the Lorenz curve
$$
\frac{\text{staked SOL}}{2}
$$
is the area of the triangle on the left of the rectangular slice
$$
\text{SUM}(\text{staked SOL} \times (\text{rank} - 1) + \frac{\text{staked SOL}}{2})
$$
is the sum of all the slices
$$
\text{COUNT(validators)}
$$
normalizes the x axis to the range 0 to 1
$$
\text{SUM}(\text{staked SOL})
$$
normalizes the y axis to the range 0 to 1
$$
\text{SUM}(\text{staked SOL})
$$